
Traffic Challenge: The Five-Star Formula—Why It Matters
Scroll down to read the article.
⌄
⌄
Declining store traffic is a problem. The Five-Star metric helps furniture retailers increase traffic, sales volume, store revenue and bottom line profitability.
Very rarely are furniture retailers satisfied with the quantity of shopper traffic entering their stores. In nearly all situations, they are engaged in a search for ways to increase it. In the July/August installment of this article series, traffic was identified as the number one challenge and one that most retailers address by trying to find the elusive “holy grail” with a balance of traditional and digital advertising.
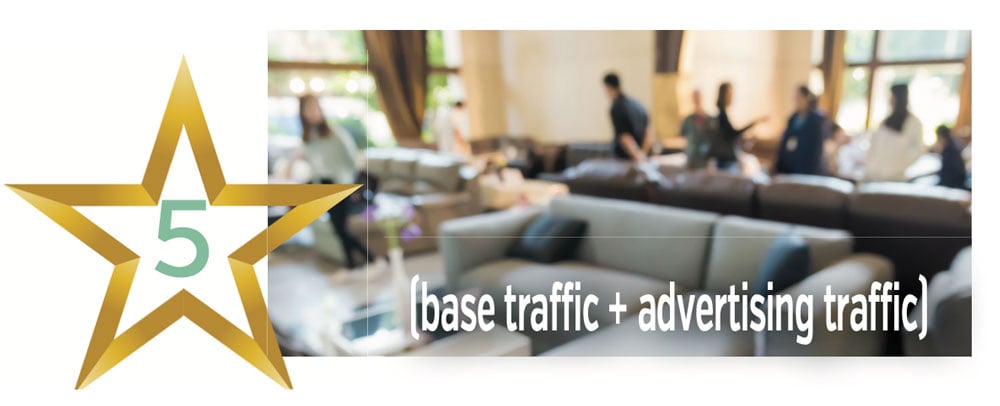
Traditional Elements #1 and #2: Base Traffic & Advertising Generated Traffic
Typically, retail traffic is thought of as a combination of, #1, base traffic plus, #2, advertising-generated traffic. Base traffic is made up of customers who would come in with-out any prompting, due to location, brand awareness, past purchases, referrals, etc. Advertising-generated traffic is bolstered by shoppers who are influenced by paid campaigns. Traffic generated by advertising can be quantified by the following formula: Advertising Traffic = Ad Spend × Response Rate.
When either base or advertising traffic declines—often due to economic, geopolitical, or other uncontrollable conditions—total traffic falls. Since In-store Sales Volume = In-store Traffic × Close Rate × Average Ticket, a decline in traffic puts revenue, profitability, and cash flow at risk.
Traffic has a significantly greater impact compared to close rate and average ticket because there is much more variation in traffic volume. Close rates (averaging 30%) and average sale (averaging $2,000–$4,000) tend to remain consistent over time, without good sales leadership and merchandising practices. When advertising slows or base traffic weakens, the traditional formula has no backup plan. That’s why retailers could benefit from a new, expanded traffic formula that helps them understand and control the levers that influence their businesses, to increase total traffic volume and, consequently, revenue and profitability.
"Traffic has a significantly greater impact compared to the other two sales levers, close rate and average ticket."
THE FIVE-STAR FORMULA
Instead of relying only on base and advertising traffic, I propose using my Five-Star Formula, a non-traditional equation that includes the following three additional, often overlooked, sources of traffic:
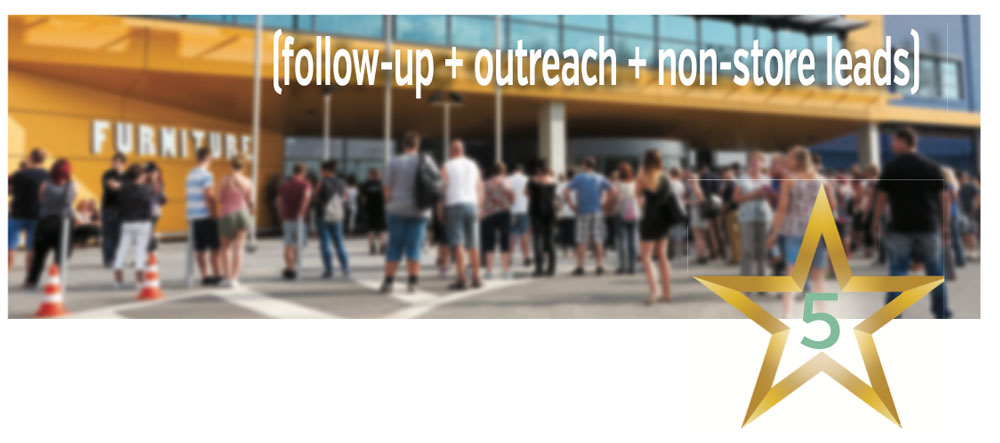
- No Purchase Follow-Up Traffic.
- Outreach Prospecting Traffic.
- Lead-Generated Traffic (Non-In-Store Leads).
Together with base and advertising traffic, these five sources create a powerful formula that can be used to consistently increase customer flow, even during downturns.
“Retailers could benefit from a new metric to help them understand and control the levers that influence businesses, beyond just base-level and advertising traffic."
The New Formula
My formula for the Five-Star metric is: Retail Traffic = Base Traffic + Advertising Generated Traffic + Traffic from No Purchase Follow-Up + Traffic from Outreach Prospecting + Traffic from Incoming Leads.
Element #3. Traffic Resulting from No Purchase Follow-Up:
The industry close rate averages about 30%. That means 70% of visitors don’t buy on their first visit. So, instead of letting interested prospects “just go,” sales teams should take proper next steps in selling, and track the results using this metric: Outreach Attempts × Positive Touch Rate × Appointment Show Rate = New Traffic from No Purchase Follow-Up.
Here’s an example of the revenue that effective follow-up with shoppers who leave without purchasing can generate: 300 outreach attempts × 50% positive contact × 50% appointment show rate = 75 returning customers. At a close rate of 90% and an average ticket of $3,000, that equals about $202,500 in additional monthly revenue. Why is the close rate so high? In the example above, customers who didn’t purchase on their first visit were already shopping. With proper follow-up, some may decide to make an appointment. My research shows that those customers with appointments purchase at high-closing rates.
Element #4. Traffic from Outreach Prospecting:
Prospecting yields different results than no purchase follow-up. Instead of re-engaging with someone who visited and left, selling professionals proactively reach out to PROVEN BEST CUSTOMERS who previously purchased with a value proposition. They use an existing contact database with a wealth of data to further build relationships. This can be done in a variety of ways including:
- Project completion review, related and complementary product suggestions.
- Invitations to VIP events.
- Vendor showcase events.
- Announcements of new product lines.
- Personalized “next logical purchase” outreach (next room or room completion).
The formula used to track outreach prospecting is Outreach Attempts × Positive Touch Rate × Appointment Show Rate = Prospecting Traffic. For example, 300 outreach attempts × 25% positive contact × 50% appointment show rate = 37.5 visitors. Rounding up to 38 visitors at a 90% close rate and an average ticket of $3,000, that’s about 34 sales totaling approximately $101,250 in monthly revenue.
Element #5. Traffic from Incoming Non-Store Leads
Today, many prospects engage with brands before they ever set foot in a physical store. Each web form submission, phone call, text, chat, a CTA (call-to-action) survey or price inquiry is an incoming lead that must be handled professionally. Advertising campaigns and marketing efforts absolutely play a part in generating these leads. However, after a lead is generated, having technology systems and human processes in place (with salespeople who are skilled at handling leads), can generate hugely valuable, warmed-up, in-store traffic.
The formula that describes this process is: Number of Leads × Appointment Show Rate = Lead-Generated Traffic. For example, 250 incoming leads × 25% appointment show rate ≈ 63 in-store visitors. At a 98% close rate and a $3,000 average sale, approximately $180,000 additional monthly revenue is generated.
Traffic from incoming non-store leads has some of the highest close rates in retail because by the time an appointment is scheduled, these prospects are usually already committed buyers.
Five-Star Traffic Components and Contributions
| COMPONENT | EXAMPLE FIGURE | CLOSE RATE | AVERAGE SALE | SALES VOLUME | CONTRIBUTION TO 5★ TOTAL $ |
|---|---|---|---|---|---|
| Base Traffic | 300 Visitors | 30% | $2,500 | $225,000 | 21.43% |
| Advertising Traffic | $30K Spend Yields 450 Visitors |
30% | $2,500 | $337,500 | 32.14% |
| Traditional Subtotal | $562,500 | ||||
| No Purchase Follow-Up |
300 Attempts Yields 75 Visitors |
90% | $3,000 | $202,500 | 19.29% |
| Outreach Prospecting |
300 Attempts Yields 38 Visitors |
90% | $3,000 | $101,250 | 9.67% |
| Incoming Leads |
250 Leads Yields ≈ 63 Visitors |
98% | $3,000 | $180,000 | 17.14% |
| Five-Star Total | $1,046,250 | ||||
"Comprehensive tracking of outreach, touches, leads, and follow-up is non-negotiable for those retailers who want to reap the benefits."
Execution: What it Takes
Expanding the traffic formula is not just about math—it’s about execution. Tracking and process leadership are two essential elements to achieve proper execution.
Tracking: Comprehensive tracking of outreach, touches, leads, and follow-up is non-negotiable for those retailers who want to reap the benefits. Therefore, a full-featured CRM system is the best tool to create accountability and communication. Without it, you end up with scattered spreadsheets, unreliable data, and no visibility into what was said to customers.
Processes Leadership
- Leadership must commit to this formula and set clear expectations.
- Salespeople must know what’s required: consistent follow-up, prospecting, and lead management.
- Daily or weekly reviews should monitor activity and results.
- Leaders should coach staff to improve outreach effectiveness.
Without leadership, most businesses default to relying only on base and advertising traffic measures—missing huge growth opportunities.
Traffic Formulas Every Furniture Retailer Should Know
Starting With RT = (TB+TA) + TN + TP + TL
RT = Retail Traffic.
TB = Base Traffic (unknown or non-influenced).
TA = Traffic from Advertising = $ spent on advertising × Response Rate.
TB + TA = Traditional Traffic Formula
TN = Traffic Produced from Outreach No-purchase Follow-up = Outreach attempted × Positive touch rate × Appointment show rate.
TP = Traffic Produced from Outreach Prospecting=
Outreach attempted × Positive touch rate × Appointment show rate.
TL = Traffic Produced from Non-Store Incoming Leads = Incoming leads × Appointment show rate.
Consider this alternative formula for understanding the traffic and sales that you may be missing:
TTR (Traditionally Tracked Traffic) = (TB + TA) − (TN + TP + TL).
URT (Underrealized Traffic) = (TN + TP + TL).
Practical Execution Details
Here are some best practices for implementing the three added traffic sources in the Five-Star model:
No Purchase Follow-Up
- Capture customer information before shoppers leave.
- Understand why they didn’t buy.
- Take good notes in the CRM and set the next action (call, email, appointment).
- Review daily follow-up activities as a team.
- Use a combination of automated technology and individual follow-up to cover all bases.
Prospecting Outreach
- Schedule regular outreach campaigns (weekly or monthly).
- Tie prospecting to events, new product arrivals, or vendor promotions.
- Use CRM reporting to track who is contacted and the results.
Lead Management
- Train designated staff to qualify leads and schedule appointments.
- Ask probing questions to build relationships.
- Respond quickly. Speed of follow-up is critical.
- Treat every inquiry as a high-value opportunity.
"Rounding up to 38 visitors at a 90% close rate and an average ticket of $3,000, that’s about 34 sales totaling approximately $101,250 in monthly revenue.”
Conclusion
Traffic is the most important driver of retail sales volume. By expanding the traffic equation from two inputs to five, retailers can generate significantly more revenue and protect their business from economic slowdowns.
My Five-Star Formula for Retail Traffic presented earlier in this article is: Retail Traffic = Base Traffic + Advertising Generated Traffic + Traffic from No Purchase Follow-Up + Traffic from Outreach Prospecting + Traffic from Incoming Leads.
This formula can be used as a starting point. It can then be expanded to include more than five points and more detail on each traffic driver. For example, specific effects and results can be included for each contact media, such as texting, email, or voice communication. It can also incorporate the sources of traffic that feed into a sales funnel under each star point. Regardless, seek to understand your traffic formula and drivers better.
Define it, track it, lead it and execute it. You might just transform your sales equation and your business.
Read more
Add 250,000 Gross Margin $$ Without Raising Prices!
Clearance sales may have their time and place, however, there are many other more productive ways to increase GMROI. You can do this without increasing prices or holding inventory clearance
Five Smart Steps To e-Tail Inventory Management
Today, consumers initiate their shopping experience. If they find you through Google, you have a chance to get their business. Here’s how to manage your e-tail inventory to make the
The Power of Family Product Reporting
Here’s how one retailer adopted product family reporting to seize control of its inventory and increase GMROI.

See initially published articles by David at Furniture World