Warehouse Improvement Metrics
Here are the metrics every home furnishings retailer needs to use to improve warehouse facilities and processes.
Scroll down to read the article.
⌄
⌄
Here's how AI has turned the financial dashboard from a screen you check or historical reports you print out into a powerful tool that enables real-time retail decision-making.
Editor’s Note: When, in 2012 David McMahon’s article, “Business Intelligence & Mobile Dashboards” appeared in Furniture World, the idea that an owner could pull up sales, margin, and inventory numbers on a phone, away from the store, felt like the future.
In this update, he reflects on that article in light of advances AI has brought to retail financial planning and execution.
When retail dashboards were introduced over a decade ago, it was a real step forward from the days of waiting for a monthly report to land on a retailer’s desk. Now, that dashboard looks basic. Not because the numbers on it stopped mattering. They matter more than ever. What’s changed is what businesses can do with those numbers, and how fast they can do it with access to clean, complete data. AI has taken the dashboard from a screen you check or reports that you print out and merge to spreadsheets, to a system that watches, flags, and in some cases predicts, before you even ask.
But before any of that technology helps you, there’s a more fundamental question every business manager must answer honestly: do you actually know where you stand? Not where you think you stand, but where you actually stand, measured against a real standard, not just your own history.
Over the years, I’ve authored multiple industry-wide benchmarking studies of the home furnishings industry, surveying retailers across North America to establish real performance standards, not guesses. Every time I’ve presented those results, I’ve recommended the same five-step process for using them:
The order of the steps listed above matters. You cannot skip to execution without first knowing where you stand. You cannot know where you stand without a real external benchmark. And you cannot sustain improvement without continuously monitoring whether your actions are working. This is the backbone of financial leadership, and it’s exactly where AI has the most to offer, not by changing the sequence, but by collapsing the time each step takes to execute.
The gap between average performers and the top 20% in this industry isn’t small, and it isn’t theoretical. Below is a small sampling of what my benchmarking studies have consistently found.
Gross Margin: The home furnishings industry average sits near 47.6%. Top 20% performers run closer to 52.2%, a gap of roughly 4.6 points. On a $10 million business, that difference alone is worth over $460,000 a year left on the table.
GMROI: The average is roughly $2.73 in gross margin generated per dollar of inventory. Top 20% performers generate closer to $3.51. On $1 million of average inventory, that’s the difference between $2.73 million and $3.51 million in gross margin from the same inventory investment.
Net Income Before Tax: Our industry’s average lands around 5.6% of sales. Top 20% performers run closer to 9.7%, a gap of roughly four points. On a $10 million operation, that’s over $400,000 in additional profitability.
Sales to Plan: Average performers routinely fall short of their sales targets, sometimes by double digits. Top 20% performers consistently hit or exceed 100% of plan.
Cash Position: Top 20% performers carry roughly 28% of total assets in cash, compared to an industry average closer to 17%. Well-run operations have more staying power.
Keep in mind, these top 20% numbers are themselves an average of that whole top performer group. The best of the best, within that top 20%, are performing even higher than these figures show. The real gap between an average operation and a truly elite one is bigger than any of these numbers alone suggest.
None of these gaps exist because average performers work less hard. They exist because top performers know their numbers, know the standard they’re being measured against, and deliberately act on the gap. That’s the entire premise of benchmarking: it isn’t about feeling good or bad about your results; it’s about giving you a real target to close in on.
We track at least 40 other metrics with our consulting and performance group clients. You must pick the ones that will drive your business forward. AI can help retailers analyze and make quicker business decisions, but that alone isn’t enough. The challenge is making the right decisions quicker. To do that, people and their AI assistants need to know what they are looking at and the drivers behind the equations.

Benchmarking only works if you’re tracking the right measures. I’ve published KPI reference guides covering four categories every furniture and mattress retailer should track:
Refreshing Core KPI Categories with AI: None of these formulas have changed. What’s shifted is the labor involved in calculating them regularly and comparing them to a real standard. Historically, pulling accurate GMROI or Net Income % required someone to extract data from their point-of-sale and accounting systems, reconcile it, and build the calculation by hand, often once a month for a disciplined furniture retailer, once a quarter if they weren’t.
Comparing those numbers to an industry benchmark meant waiting for the next published study. AI-assisted tools can now calculate this entire set of KPIs continuously and hold them up against real benchmarks on an ongoing basis, not just once a year.
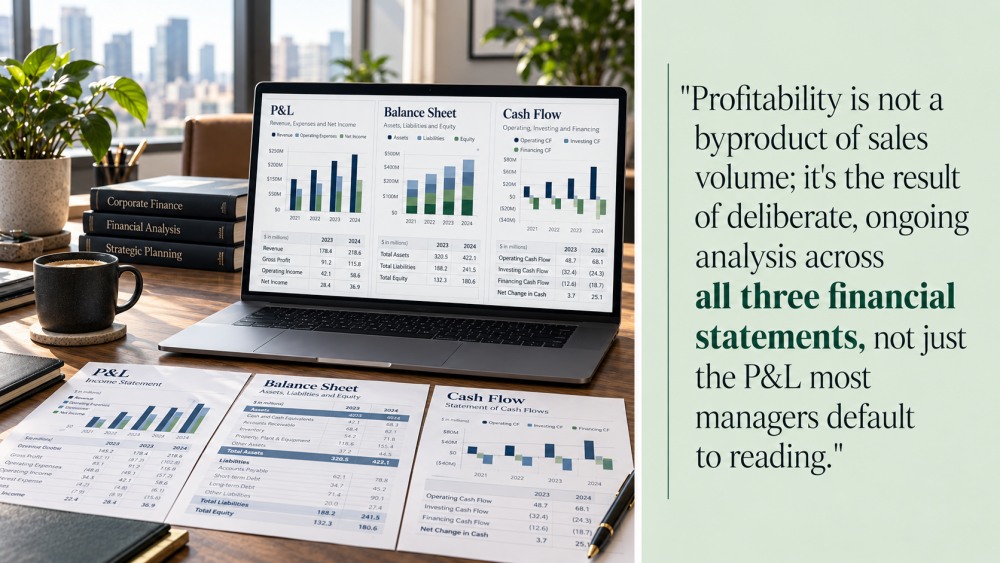
You might want to review a three-part series I wrote for Furniture World in 2012 titled “Think Profit!” covering the P&L, the Balance Sheet, and Cash Flow.
The core message is the same today: profitability is not a byproduct of sales volume; it’s the result of deliberate, ongoing analysis across all three financial statements, not just the P&L most managers default to reading.
In the P&L installment, readers were introduced to a case study of a store doing $5.26 million in budgeted sales. They learned how a handful of targeted improvements, tightening the selling system, adjusting inventory to lift gross margin, and refining merchandising and delivery, moved Earnings Before Taxes to over 13%, generating more than $700,000 in additional profit. None of those individual fixes were dramatic. Together, they were the difference between an average year and a top 20% year.
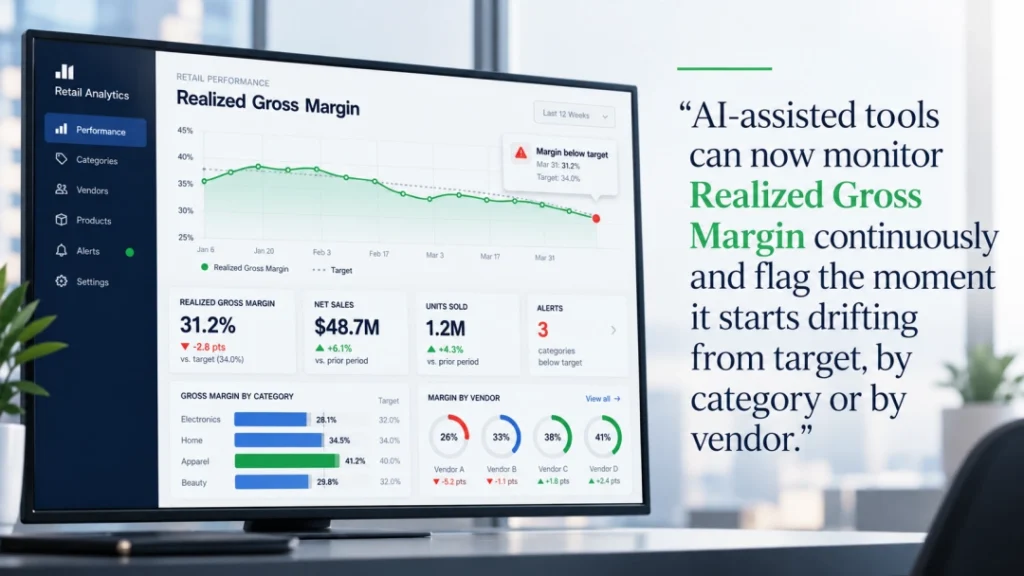
Catching erosion with AI: Realized Gross Margin is a metric managers can track to create these kinds of results. The difference between traditional Gross Margin and Realized Gross Margin is that Realized Gross Margin accounts for discounts, inventory markdowns, vendor rebates, and financing or credit card fees that traditional Gross Margin calculations ignore. In one instance, a retailer I worked with used Realized Gross Margin to identify and correct for $410,000 a year in previously invisible margin erosion.
That kind of gap used to require a deliberate analysis to uncover. AI-assisted tools can now monitor Realized Gross Margin continuously and flag the moment it starts drifting from target, by category or by vendor.
Flexible Budgeting separates variable costs from fixed costs to see what happens to profitability if sales come in at, for example, 90% of plan, or 110% of plan. That framework hasn’t changed. What’s changed is how fast retailers can build on it.
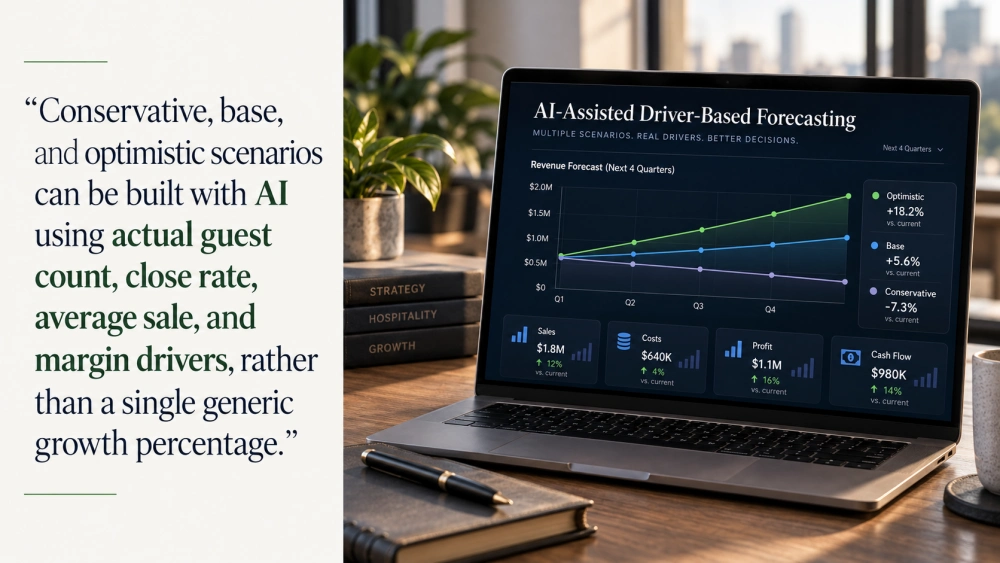
Flexible budgeting with AI: Instead of flexing a single sales assumption once a quarter by hand, AI-assisted tools can now take that same current-state model and build out full driver-based forecasts in minutes: sales, costs, profit, and cash flow, under multiple scenarios at once.
Conservative, base, and optimistic scenarios can be built with AI using actual guest count, close rate, average sale, and margin drivers, rather than a single generic growth percentage. Extending that same model into inventory and cash provides a complete financial picture, P&L, balance sheet impact, and cash position from one set of assumptions, rebuilt as often as desired instead of only once a year.
This is exactly the kind of work that took a skilled analyst days to build and rebuild by hand. AI doesn’t change the underlying flexible budgeting logic. It just means it can answer “what if” questions more often, and get real answers the same day instead of the same month.
The Balanced Scorecard framework uses four Critical Success Factors to drive performance:
Each factor has its own strategic objectives, measures, targets, and initiatives all pointed at one overall goal and tied back to the five-step benchmarking process: know where you stand, set the target, execute the tactics, monitor the movement, and keep raising the bar.
Scorecarding with AI: The weakness scorecards have in driving performance has never been due to the framework. It’s been the update cycle. Reviewing a scorecard once a month is far better than not reviewing one at all, but a month is a long time to operate without knowing whether you’re closing the gap or falling further behind.
AI-powered dashboards close that gap by updating measures like Sales to Plan, GMROI, and Realized Gross Margin continuously instead of monthly, and comparing them against real industry benchmarks rather than just your own history.
AI is powerful, but it can’t replace the fundamentals. Retailers still need to know which KPIs matter for their businesses. They still need a real external benchmark, not just their own trend line. They still require a scorecard that ties financial and non-financial measures back to one overall goal, and the discipline to execute against it month after month. AI doesn’t build any of that for you. What it does is remove the lag between when a number moves and when you know it moved, and between when you have a question and when you get a real answer.
The businesses that get the most out of AI-enabled tools will be the ones that already had the discipline to track KPIs, benchmark honestly, and build a real scorecard. AI gives that discipline much more speed and a much easier way to get started.
About David McMahon
David McMahon is founder of PerformNOW Inc. PerformNOW has three main products that help home furnishings businesses improve and innovate: Performance Groups (Owners, Sales managers, Operations), PerformNOW CXM (Customer eXperience Management systems and processes), Furniture business consulting. Your can reach David at [email protected].
Here are the metrics every home furnishings retailer needs to use to improve warehouse facilities and processes.
Some retailers seem to always manage to perform well. In this article David McMahon takes a close look at what those successful retailers do to cut costs during lean times
Retailers use CXM to automate sales and service processes. Automation triggers save time and produce meaningful results quicker.